Inflation is the Highest in 40 Years. How does this affect stock market returns?
The Consumer Price Index for the month of January hit a 30 year high at 7.5%
annualized rate or 0.9% within the month of January. This further illustrates
the impact of the supply chain disruptions and shortages and indicates that
this is not a problem that will be solved quickly.
Source: Bureau of Labor Statistics, Data as of January 1st 2022
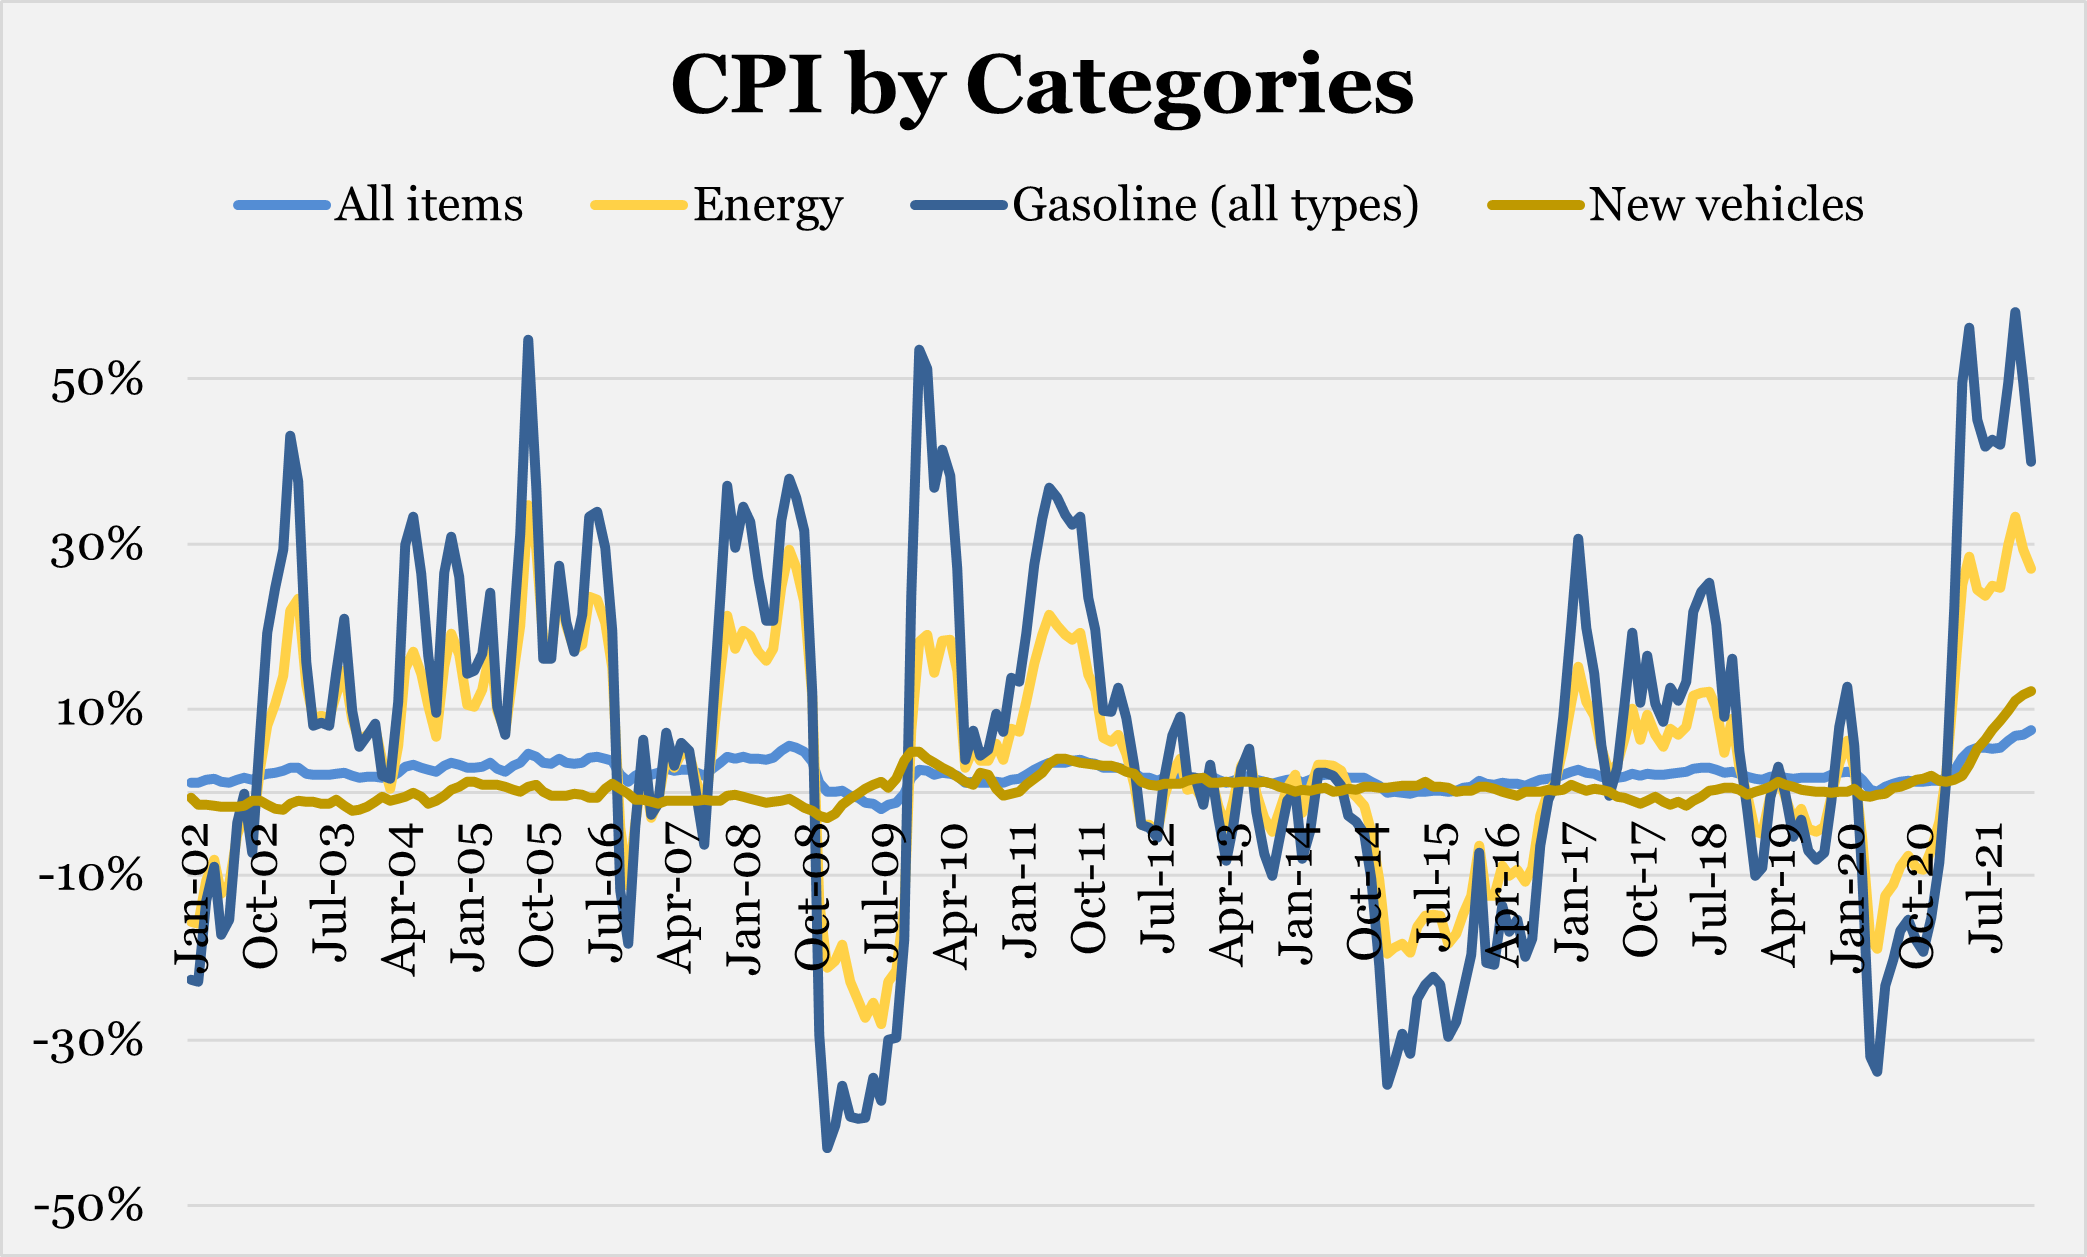
As shown in Figure 1, the largest increases are Gasoline, Natural Gas, and New Cars, each of which are at decade or multiple decade highs. These increases are the next domino to fall in the chain of events that have prevented us from returning to “normal” and has further motivated the Federal Reserve to use a word other than transitory. That being said how impactful are these increases on the US economy and how significant are these increases?
Figure 1
Source: Bureau of Labor Statistics, Data as of January 1st 2022
As shown in Figure 1, the largest increases are Gasoline, Natural Gas, and New Cars, each of which are at decade or multiple decade highs. These increases are the next domino to fall in the chain of events that have prevented us from returning to “normal” and has further motivated the Federal Reserve to use a word other than transitory. That being said how impactful are these increases on the US economy and how significant are these increases?
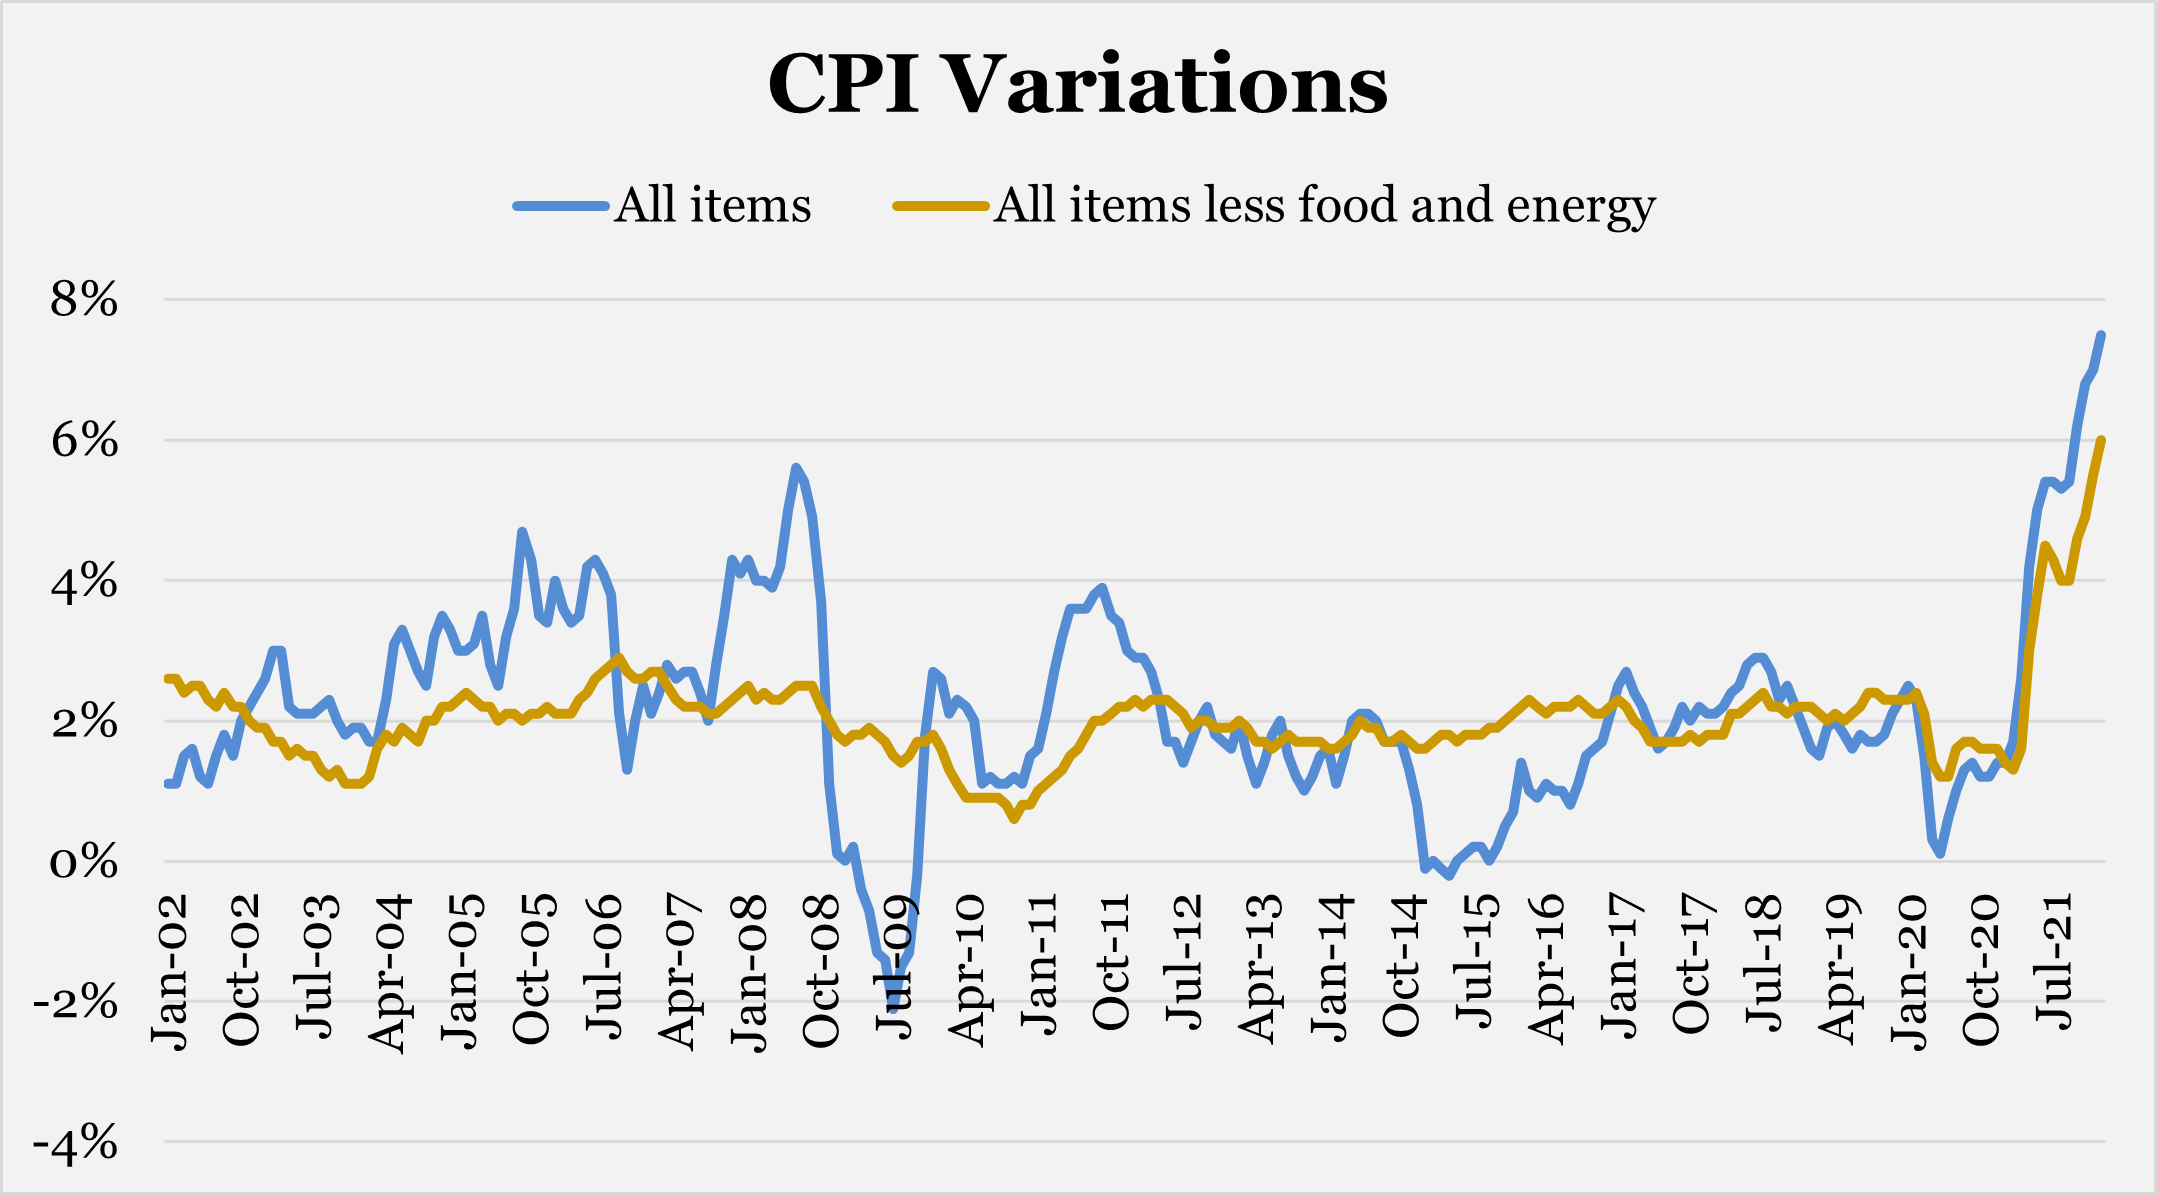
Shown in Figure 2 is total CPI charted with CPI less food and energy,
which are its most volatile constituents.
This chart shows two things, first of
which is that sometimes CPI fluctuates based on very volatile categories such
as in the financial crisis total CPI plummeted while the other had little change.
The second thing is that the current inflation is much more impactful on the
economy than an oil shock or drought, this inflation has affected nearly every
category in the index. So, inflation is here, and it’s not certain how long it
will stay, so the question becomes how will markets perform in light of the
highest inflation in 30 years?
Source: Bureau of Labor Statistics, Data as of January 1st 2022
Figure 2
Source: Bureau of Labor Statistics, Data as of January 1st 2022
To answer this question, we must look at the
historical relationship between markets, more specifically real returns,
and inflation. After looking at data going all the way back to 1914, as shown
in Figure 3, and looking at different relationships between these two
data sets, there is no significant correlation between inflation and the real
returns of the S&P 500.
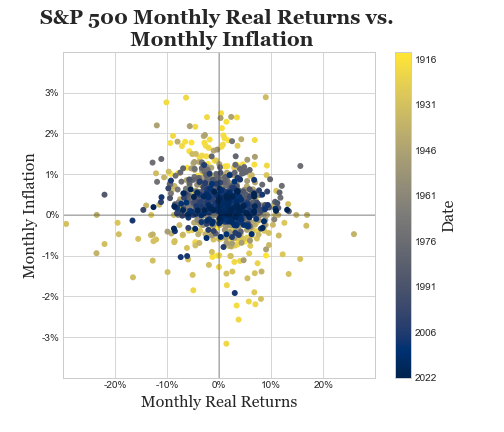
Source: St. Louis Federal Reserve, Bureau of Labor Statistics, Standard & Poor; Data as of January 1st 2022
Also, there was no meaningful relationship between the
level of inflation and correlation, implying that very high or low inflation
does not change the relationship between inflation and returns. There was also
no meaningful relationship between excess real returns for different sectors
and levels of inflation. That being said, inflation and correlation, at least
what little correlation there is, have both been trending toward zero over the
past hundred years as shown in Figure 4.
Figure 3
Source: St. Louis Federal Reserve, Bureau of Labor Statistics, Standard & Poor; Data as of January 1st 2022
This trend can be attributed to the fact that inflation has trended downward since the 1970s inflation crisis while real returns have remained relatively stable. One explanation for this is that there are simply more assets to choose from to put in the S&P 500. According to the SEC there were only about 1,000 public companies in 1935 which grew to be over 8,000 in 1995 and about 4,000 now. It is possible that the S&P might not be the best indicator of market performance simply because of its limited size which might not include a lot of the fluctuations in markets. Another possible explanation is that the mega corporations in the S&P index are far more concerned with producing steady stable returns now that over half of all Americans are invested in markets, compared to a mere 10% back in 1929.
Figure 4
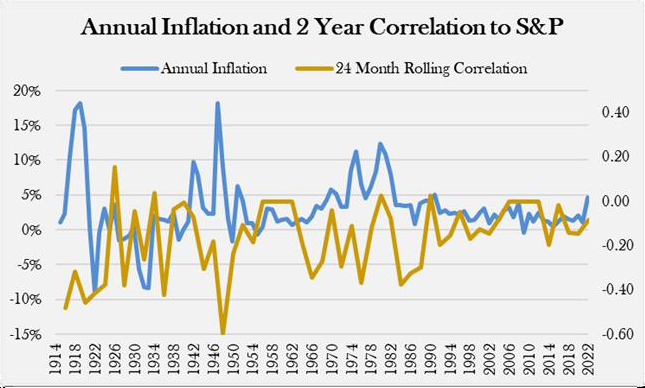
Source: Minneapolis Federal Reserve, Bureau of Labor Statistics, Standard & Poor, Data as of January 1st 2022
Disclosures:
Investing involves market risk, including possible loss of principal, and there is no guarantee that investment objectives will be achieved. Past performance is not a guarantee of future results.
Asset allocation/diversification does not guarantee a profit or protection against loss.
The Bureau of Economic & Asset Research at Berkeley does not provide tax, legal or accounting advice. Information presented is not intended to provide, and should not be relied on for tax, legal and accounting advice. You should consult your own tax, legal and accounting advisors before engaging in any financial transaction.
The price of equity securities may rise or fall due to the changes in the broad market or changes in a company's financial condition, sometimes rapidly or unpredictably. Equity securities are subject to 'stock market risk' meaning that stock prices in general may decline over short or extended periods of time.
When investing in mutual funds or exchange traded funds, please consider the investment objectives, risks, charges, and expenses associated with the funds. The prospectus contains this and other information, which should be carefully read before investing. You may obtain a fund's prospectus by visiting the fund company's website.
All companies referenced are shown for illustrative purposes only and are not intended as a recommendation or endorsement by the Bureau of Economic & Asset Research at Berkeley in this context.